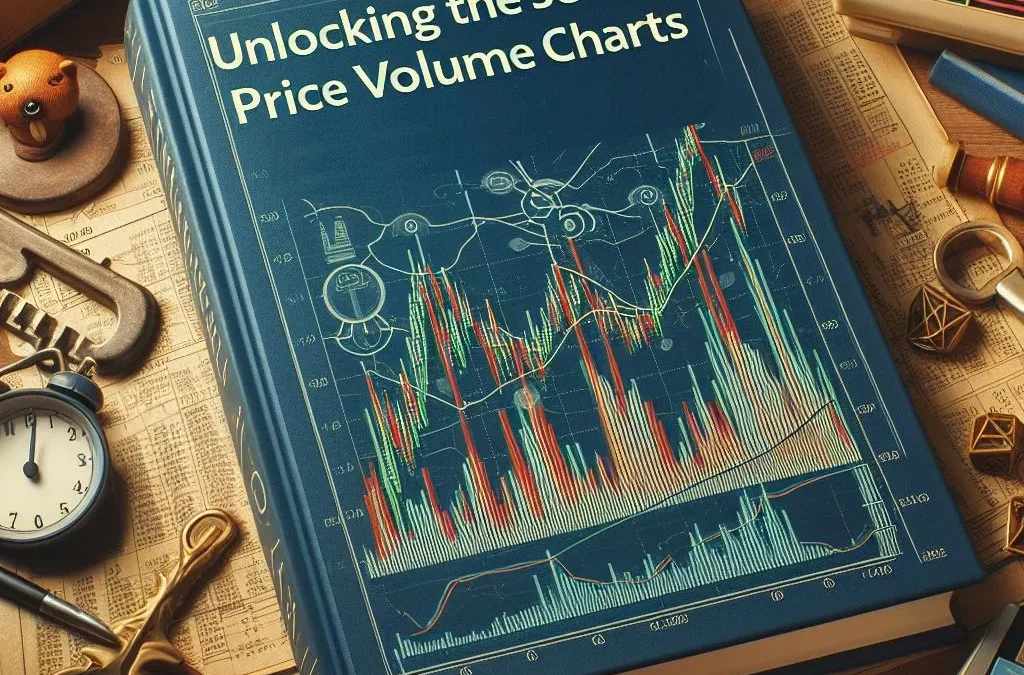
Price and volume relative charts are powerful tools in the field of technical analysis, providing valuable insights into the performance of stocks and other financial assets. By visualizing the relationship between price movements and trading volume, these charts help investors make informed decisions and navigate the complexities of the market.
Understanding Price & Volume Relative Charts
Price and volume relative charts, also known as PVR charts, represent a graphical depiction of a stock’s price and its corresponding trading volume over a specific period. These charts are constructed by plotting the price data on the y-axis and the volume data on the x-axis, allowing for a comprehensive analysis of market trends.
The key elements of price and volume relative charts are the price trend line and the volume bars. The price trend line connects the closing prices of the stock at different points in time, providing a visual representation of the stock’s price movement. On the other hand, the volume bars indicate the trading volume for each corresponding period, illustrating the level of market activity.
Using these charts, investors gain a holistic view of the stock’s behavior, enabling them to identify patterns, trends, and potential buying or selling opportunities. PVR charts are often preferred over other technical analysis methods, as they offer a comprehensive representation of both price dynamics and market participation.
Interpreting Price & Volume Relative Charts
Interpreting price and volume relative charts requires a keen eye for patterns and a thorough understanding of key indicators commonly used in technical analysis. By analyzing different elements of these charts, investors can extract valuable insights into the stock’s performance.
One of the primary aspects to consider when interpreting PVR charts is the identification of trends. By examining the price trend line, investors can determine whether the stock is experiencing an upward, downward, or sideways trend. This information helps in assessing the stock’s overall health and its potential for future price movements.
The relationship between price movements and trading volume is an essential factor in analyzing PVR charts. A surge in volume during a price increase signifies a high level of market participation, indicating the strength and sustainability of the upward trend. Conversely, a decline in volume amid price increases could be a sign of weakening demand, suggesting a potential reversal in the stock’s performance.
In addition to trends and volume analysis, PVR charts provide various trend indicators to assist investors in decision-making. Moving averages, for example, smooth out price fluctuations by calculating the average price over a specified period. These moving averages help identify potential entry and exit points, indicating when to buy or sell a stock.
Using Price & Volume Relative Charts for Stock Performance Evaluation
PVR charts serve as powerful tools for evaluating the performance of individual stocks. By applying technical analysis techniques, investors can make informed investment decisions based on the insights derived from these charts.
Assessing the strength and sustainability of a stock’s price trend is essential when evaluating performance. By analyzing the slope and consistency of the price trend line, investors can evaluate the stock’s stability and potential for future growth. A steady, upward-sloping trend line indicates a healthy stock, while a downward-sloping trend line suggests potential decline.
Another valuable application of PVR charts lies in identifying potential buying and selling signals. By recognizing patterns such as breakouts and pullbacks, investors can anticipate price movements and capitalize on market opportunities. These signals, coupled with supportive volume analysis, offer a well-rounded assessment of the stock’s future trajectory.
PVR charts also play a crucial role in determining support and resistance levels. Support levels are price levels at which buying pressure is anticipated, preventing the stock from declining further. Conversely, resistance levels are price levels at which selling pressure is expected, hindering further price increases. By identifying these levels, investors can adapt their strategies accordingly, enhancing their risk management approach.
Applying Price & Volume Relative Charts to Other Financial Assets
While PVR charts are primarily associated with stocks, their applications extend beyond equities. These charts can be employed to evaluate the performance of other financial assets, such as options, commodities, currencies, and indices.
Their effectiveness in analyzing other financial assets relies on the same principles applied to stock market analysis. Whether analyzing options price movements, commodity futures, or currency exchange rates, PVR charts provide a visual representation of price dynamics and trading volume, offering valuable insights into market trends.
Case studies further illustrate the successful applications of PVR charts in different markets. For instance, the analysis of commodity price movements through PVR charts enables traders to identify supply and demand imbalances, predicting future price fluctuations. In currency markets, a strong correlation between price movements and trading volume can help forecast exchange rate changes.
Conclusion
Price and volume relative charts are indispensable tools for investors, providing a comprehensive understanding of stock performance and other financial assets. By examining trends, volume analysis, and applying technical indicators, investors can make informed decisions and capitalize on market opportunities.
Incorporating PVR charts into investment strategies allows for a systematic approach to evaluating stock performance. Whether assessing the strength of a price trend, identifying potential buying/selling signals, or determining support and resistance levels, these charts offer valuable insights to navigate the ever-changing stock market. Additionally, their versatility transcends stocks, making them a valuable tool for analyzing other financial assets.
Unlocking the secrets of price and volume relative charts empowers investors to unlock opportunities and make informed decisions, leading to superior stock performance and increased investment success.

